Federal HHS grant working on the opioid epidemic focused on American Indian and African American population
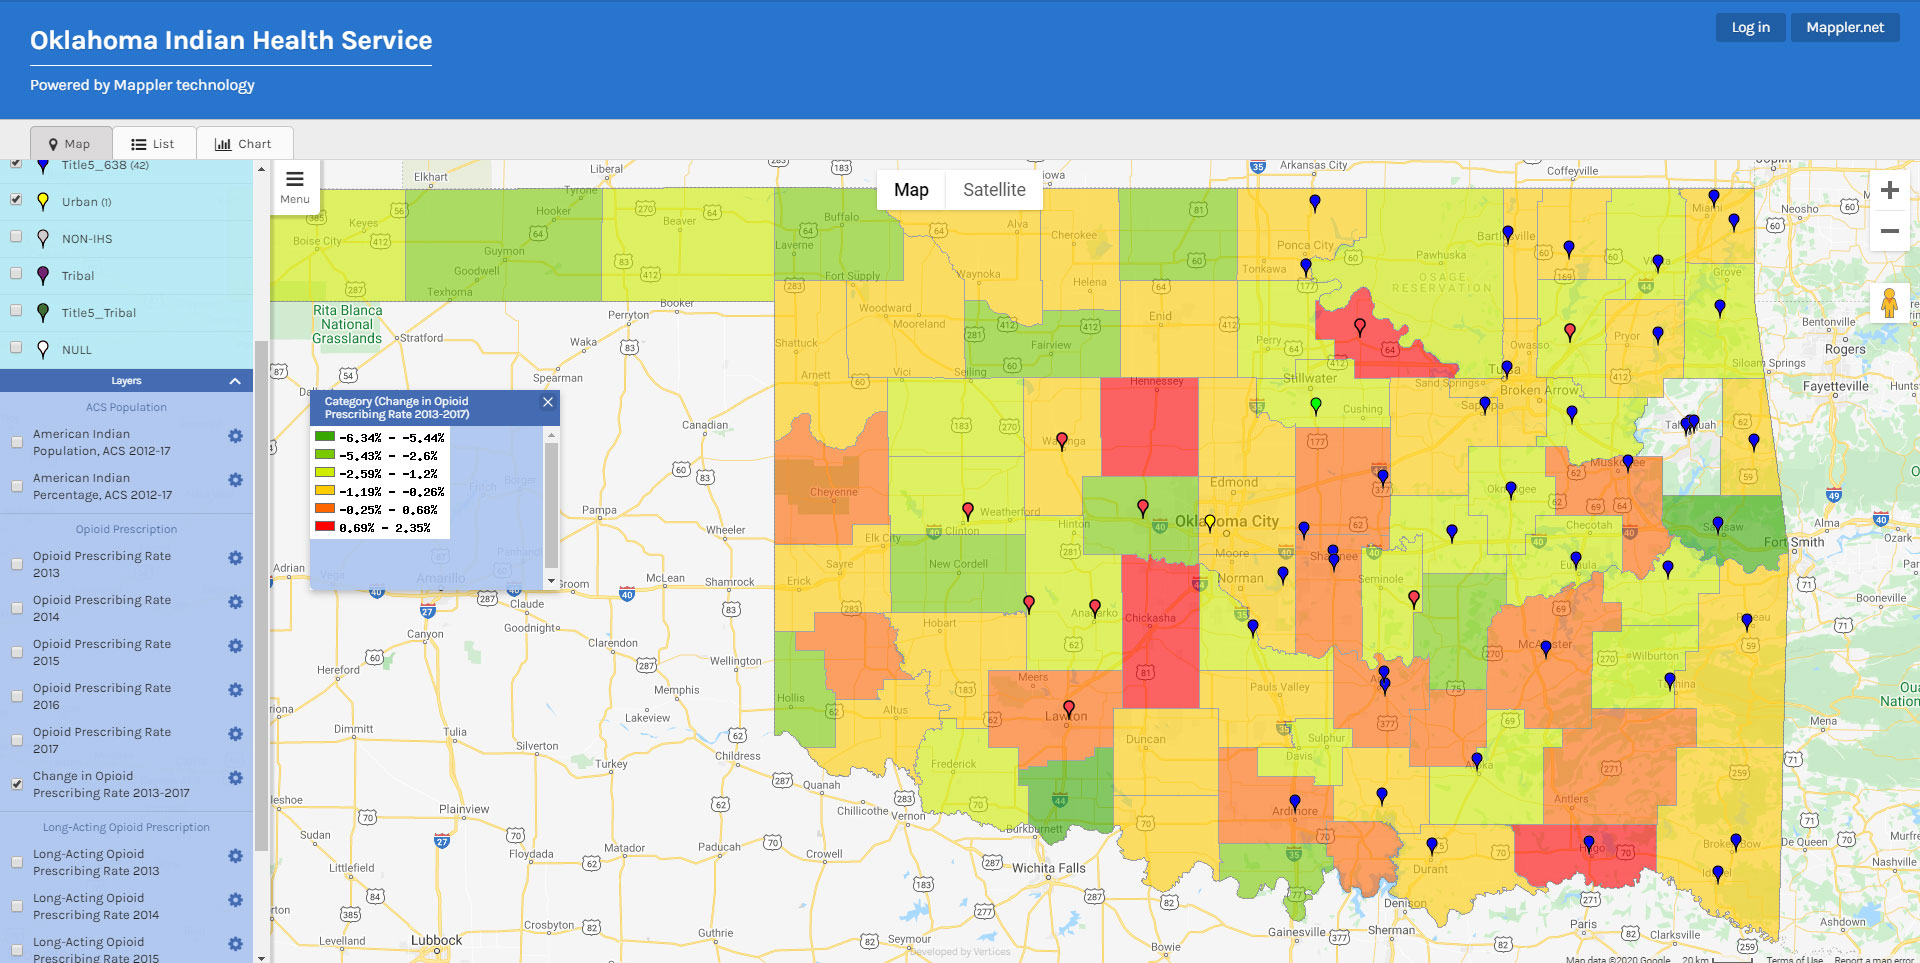
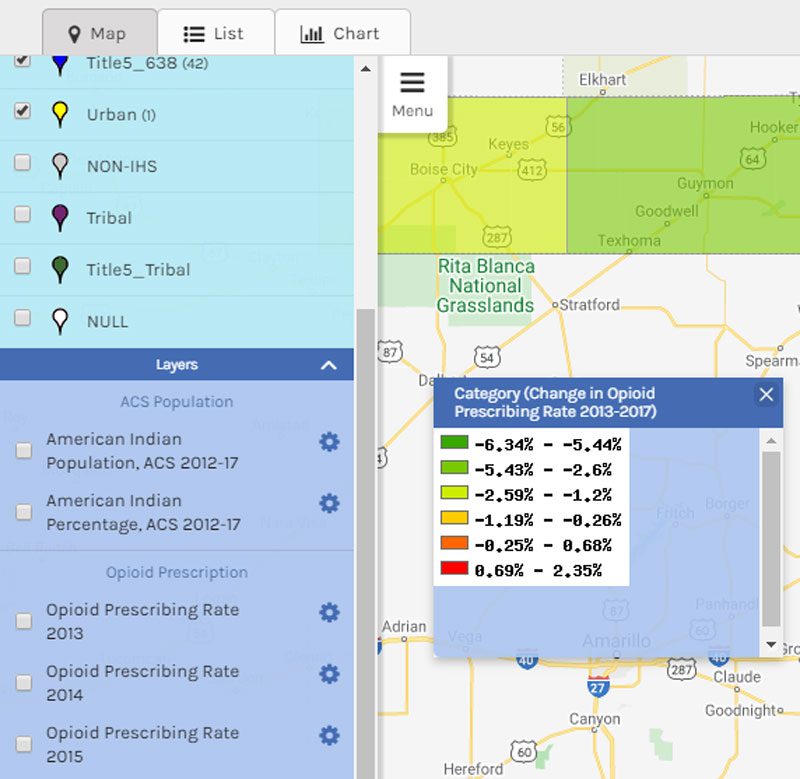
We mapped geographical data using a GIS system
Many different types of data and categories plotted on one map
The challenge: Finding useful patterns in the data
The GIS system is useful because analysts can gain information from the map.
Microsoft Excel and business intelligence tools help us find trends, but the questions posed are limited by the analyst’s biases.
We looked at various AI tools including Google Tensorflow™, Pytorch™, and Amazon SageMaker™.
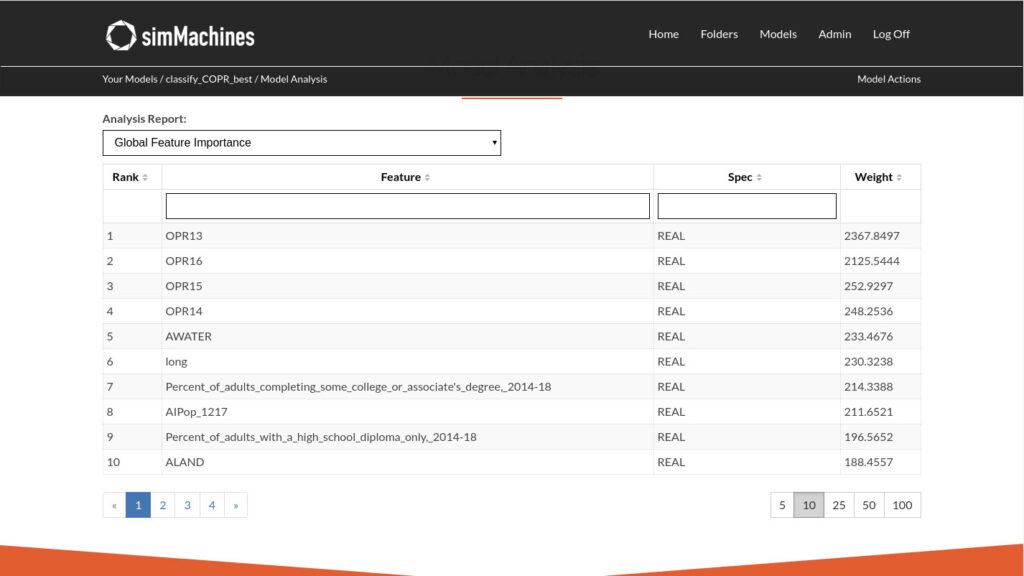
We chose to work with simMachines™ because the time and cost to develop predictive models was a fraction of other solutions and excellent reference accounts such as American Express and Starbucks.
simMachines meets the recent explainable AI requirements put forth by the FDA.
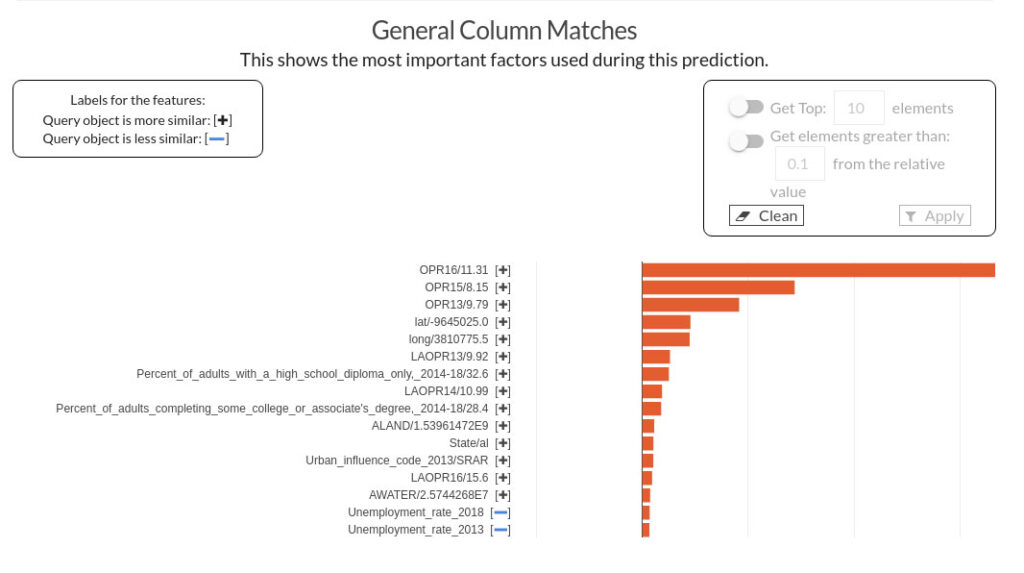
One of the models predicts if a county will have increased or decreased opiod prescription rates
The simsMachines model will explain why it made the prediction
The "why" of Artificial Intelligence (AI) is critical
The federal government and FDA require explainability.
The simMachines model provides detailed high-resolution information about the “why” in a single pass. Explainability is built into the algorithm.
Predictive models degrade over time and explainability helps quickly find the reasons for the degradation. This lowers the time and cost for maintaining a good model.
Sometimes the “why” is more helpful than the prediction!